Recently, while working on my portfolio website, I hit a performance issue that completely threw me off.
On the homepage, I use a circular mask to reveal a colored manga panel on top of a black-and-white one.
To add interactivity, I had it follow the pointer by updating the mask’s draw position via CSS variables each frame.
On Chrome and Firefox, it ran buttery smooth while on Safari it lagged noticeably… of course.
Before we go any deeper, here’s Safari v18.6 before and after the fix:
BeforeAfter
As you can see, it was not completely unusable, but it was definitely frustrating.
I postponed this issue for a few days to focus on other features, but I was determined
to eventually provide a smooth animation experience across all major browsers.
When it was time to tackle it, I dug in.
At first I thought it’d be an easy fix: scope the variables, shrink the mask, simplify the logic…
to my surprise, nothing made a difference.
At that point, I wasn’t thinking about the Rendering Pipeline or GPU promotion at all,
I was just trying everything I could think of that made sense to me.
After a lot of trial and error, I stumbled across a Stack Overflow answer suggesting this one-liner:
transform: translateZ(0);
After all the trial and error, my mindset was simple: “I’ve already tried so many things, what’s one more?” so
I added it even though it seemed like it shouldn’t do anything.
Suddenly… Safari was smooth as butter…
Confusion of the highest orda!
What on earth just happened? Why did this work?
This tiny one-liner pushed me down a rabbit hole…
I thought I knew enough about how browsers transform code into pixels, but this specific issue humbled me quickly.
I didn’t just want to understand why this fix worked; I wanted to understand the browser deeply enough
that I wouldn’t need to rely on magic incantations from the web next time.
What started as a simple Safari quirk turned into a deep dive, thanks to a stranger’s tip and a healthy dose of stubbornness.
As usual, I took notes throughout the journey, and I’m happy to share a condensed, better-phrased version in my very first article :)
After all, that’s why I created this blog: to share what I learn.
Without further ado, let’s jump right into it!
Why Bother with the Rendering Pipeline?
The thing about frontend performance problems is that sometimes they look completely random.
Every browser seems to behave a little differently, and they do, but under the hood they follow
the same broad sequence of steps to turn HTML and CSS into pixels on the screen, even if the exact implementation details differ.
This sequence is called the Rendering Pipeline.
Knowing how that pipeline works doesn’t just satisfy curiosity, it changes the way you debug and build:
You stop guessing
Instead of “maybe reducing the mask size will help”, you can ask yourself: “Is the bottleneck Style, Layout, Paint, or Compositing”?
You know which properties are safe to animate transform and opacity are Compositor-friendly, while top, left, or width force Layout and Paint.
You understand why browser differences happen
Chrome and Safari use different heuristics for promoting elements to GPU layers (which explains why the one-liner made a difference in one and not the other).
You make better design calls early
You’ll know when a heavy blur or mask will eat GPU cycles, and when it’s safe to use them.
In other words: understanding the rendering pipeline makes the invisible steps visible, and actionable.
You don’t need to memorize every detail, even a rough mental model helps you reason about performance issues instead of relying on Stack Overflow magic.
The Rendering Pipeline in a Nutshell
Before diving deep into each stage, it helps to have a high-level map of what actually happens when a browser renders a page.
At a conceptual level, every browser engine follows the same six broad stages to turn code into pixels:
Parsing
HTML is parsed into the DOM (Document Object Model).
CSS is parsed into the CSSOM (CSS Object Model).
Style Recalculation
The DOM and CSSOM are matched together to produce computed styles for each element.
Layout (Reflow)
Computed styles are used to compute each element’s geometry creating a layout
tree. A map of where every visible, renderable element goes.
Paint & Rasterization
Paint: elements are turned into a list of drawing commands: display list.
Rasterization: the browser rasterizes the page into smaller chunks called tiles, enabling efficient partial redraws.
Compositing
Some elements are promoted into GPU-backed layers.
The compositor thread assembles the tiles and layers into the final frame.
Display
The GPU swaps the back buffer with the front buffer in sync with the monitor’s refresh rate (VSync).
JavaScript isn’t a stage of the rendering pipeline itself, but it can affect nearly every phase.
Scripts can modify the DOM or CSSOM (e.g. element.style, classList.add(), or appendChild()), which forces the browser to re-trigger some parts.
Engine differences
While the high-level pipeline is the same across browsers, each engine has its own quirks in how it structures these stages:
Blink (Chrome/Edge):
Splits the Paint stage into extra phases: Pre-Paint which figures out what needs repainting, and Layerize which decides which elements become GPU-backed layers.
WebKit (Safari):
Sticks closer to the canonical six stages. Invalidation logic is folded into Paint, and layer promotion is handled by its RenderLayer system.
Gecko (Firefox):
Uses WebRender, which parallelizes style calculation in Rust (via Servo’s Stylo engine) and hands the display list directly to the GPU. Rasterization and compositing are mostly GPU-driven.
Conceptually, though, they’re all doing the same job: Parse → Style → Layout → Paint → Composite → Display
Let’s take a closer look at each stage.
1. Parsing
When the browser loads a page, it starts by parsing the source files.
Parsing is the act of taking raw text, HTML or CSS, and turning it into structured data that the engine can work with.
The engine’s parser validating your code
What happens here
HTML is parsed into the DOM.
CSS is parsed into the CSSOM.
Synchronous <script> tags can pause parsing until they’re executed.
HTML → DOM
The HTML parser, called “HTMLTreeBuilder” in both Blink and WebKit, “HTML5 Tree Builder” in Gecko,
reads the markup and produces the DOM (Document Object Model).
The DOM isn’t stored as JSON or XML on disk, it lives as an in-memory tree of objects, each representing an element, attribute, or text node.
Which JavaScript can interact with using APIs like:
document.querySelector("div")
node.textContent
etc…
See how the class attribute is stored as a string and is retrievable via element.className,
but JavaScript also exposes element.classList as a DOMTokenList for easier manipulation.
Attributes live in a NamedNodeMap (map-like structure, unique keys), while children live in a NodeList (ordered list of nodes).
In practice: attributes behave like a map, children like an array.
CSS → CSSOM
The CSS parser, literally named “CSSParser” in Blink and WebKit while Gecko uses Servo’s CSS parser called “Stylo”, reads stylesheets
and produces the CSSOM (CSS Object Model).
This is another in-memory object graph: rules, selectors, and declarations.
The selectorText is preserved exactly as written.
Both .box.highlight and .highlight.box match the same elements but appear as two distinct rules in the CSSOM.
JavaScript interlude
Parsing HTML isn’t always a straight shot.
When the parser encounters a synchronous <script> tag, it pauses.
Why? Because scripts can mutate the DOM, for example by inserting elements via document.write(),
so the parser has to wait for JS to finish before continuing.
This is why long-running synchronous scripts can delay page load.
Avoiding parser blocks:
defer → script downloads in parallel, but executes after parsing finishes.
async → script downloads in parallel and executes immediately when ready (order not guaranteed).
Both allow parsing to continue without blocking, but serve different needs. Use defer when script order matters,
and async for independent scripts (e.g. analytics).
Output of this stage
With DOM and CSSOM built, the browser now knows what content exists and what rules apply.
The next step is to resolve them together into concrete styles.
2. Style Recalculation
This stage is sometimes referred to as Style Calculation. It’s where cascade, inheritance, and variables are resolved into computed styles.
What happens here
The browser walks the DOM tree and matches each node against rules in the CSSOM.
It applies the cascade (specificity, importance, source order) and inheritance rules.
Custom properties (--variables) are resolved, unlike normal properties, variables are not resolved until this stage.
Each element ends up with a computed style: every property has an absolute value.
Relative values (%, em, …) stay unresolved at this stage,
since they depend on the size of the parent or the viewport.
They’re resolved during Layout.
Notice how relative values (1rem, var(--main-color)) are turned into absolute values (16px, rgb(255,0,0)).
Browsers also apply built-in user-agent stylesheet alongside yours.
That’s why <h1> looks bigger than <h2> by default, or why elements like <div> come with display: block;
and margin: 0; even if you never set them yourself.
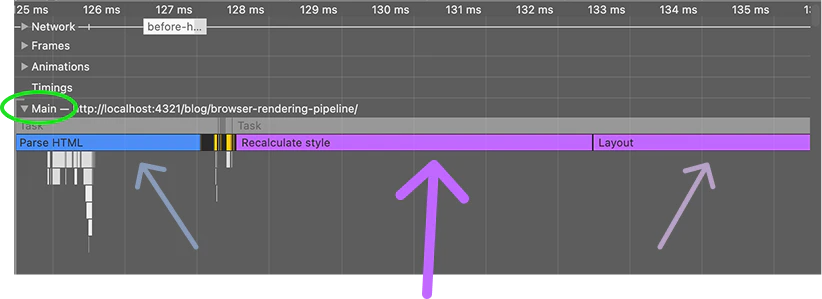
In Chrome DevTools > Performance panel, the stage appears as Recalculate Style under the Main thread.
While in DevTools > Elements panel, you can see the results under the Computed tab describing the computed styles.
DevTools > Performance panel > Main thread (other stages appear as well)
CSS Variables and Scope
This is where CSS variables behave differently from normal properties.
They cascade, inherit, and resolve at style recalculation time, which has important performance implications.
Scope:
A variable is visible from the node where it is defined, down through all of its descendants (unless overridden).
Defining --color on :root makes it available to every element in the page.
Defining it on a specific element limits its scope to that element and its subtree.
The browser recalculates styles for the element and any of its descendants, since variables inherit.
If the variable is defined on :root, then any element in the page could potentially be affected.
Modern engines track which elements actually reference the variable and only recalc those nodes,
but since the scope is global, the dependency graph can still be large.
Types of properties:
If the variable controls a non-inherited property (e.g. border-color), only the element using it needs recalculation.
If it controls an inherited property (e.g. color, font-size), children may also need recalculation.
If it controls geometry/layout (e.g. width, height, transform: scale(var(--x))), the element’s box geometry changes.
That invalidates its subtree, so even children that don’t use the variable directly may still need recalculation.
Deduplication:
If a child is marked “dirty”, both because it uses the variable and because its parent’s layout changed, the browser won’t recalc it twice.
Engines coalesce multiple invalidation reasons so each node is recalculated at most once per pass.
CSS variables don’t behave like constants that are resolved at parse time, they remain “live.”
Their definition scope determines the potential set of affected nodes, while usage determines which nodes actually trigger recalculation.
This flexibility is what makes them powerful, but also what can make updating root-level variables every frame very expensive.
Output of this stage
The output of this stage is a computed style map where each DOM element has a
resolved set of styles, think of it as a big object with key-value pairs.
But knowing what each element “looks like” isn’t enough to render it.
We still don’t know where each box sits on the page, or how they overlap.
That’s what the next two stages answer:
Layout → geometry (position and size)
Paint → visual details (draw order and raster)
3. Layout (or Reflow)
Once every element has its computed styles, the browser’s next job is to figure out where things actually go on the page.
This stage is called Layout, or Reflow when it runs again after changes.
What happens here
The browser builds a Layout Tree (also called a Frame Tree in Gecko).
An in-memory structure derived from the DOM + computed styles, but filtered down to only visible, renderable elements.
Nodes with display: none; are excluded entirely.
Nodes with visibility: hidden; are included (they occupy space, but are not painted).
Pseudo-elements (::before, ::after) also appear here, even though they don’t exist in the DOM.
Each node in the tree gets precise geometry from the box model: its position, width, height, padding, borders, margins, line breaks, etc.
Inline text is measured and split into line boxes.
Relative values (%, em, vh, …) are resolved against parent geometry or viewport.
The browser now knows exactly where that box and its content should sit on the page.
Why “Reflow”?
Because this isn’t a one-time step.
Any change that affects geometry: resizing the window, adding/removing elements,
or updating certain styles, can force the browser to run layout again.
Why this stage can be expensive
Layout depends heavily on relationships between elements.
A small change in one place (like flexbox alignment or table sizing) can ripple outward,
requiring recalculations for siblings, children, or even the entire document.
DOM APIs like getBoundingClientRect() or offsetWidth can also force synchronous layout:
the browser pauses JavaScript, updates the layout tree, and only then returns the result.
This is sometimes called layout thrashing when it happens repeatedly in animations or loops.
offsetWidth returns an element’s rendered width (content + padding + borders, no margins).
But reading it forces layout to run synchronously, pausing JS execution until the tree is up to date.
Developers sometimes exploit this:
el.classList.remove("animate");void el.offsetWidth; // force layout flushel.classList.add("animate"); // restart animation
It’s a handy trick, but overusing it (e.g. in loops or animation frames) can trigger repeated reflows and visible jank.
Layout has to juggle many interdependent rules: block and inline formatting, flexbox and grid calculations
(sometimes requiring multiple passes), intrinsic sizing, and special cases like replaced elements
(<img>, <video>, <iframe>), which behave like normal boxes but whose contents come from outside the DOM
(decoded pixels, video frames, or entire nested documents).
With so many moving parts, even a small change can ripple far beyond a single node.
Output of this stage
The Layout Tree, an in-memory structure with precise box positions and dimensions.
Next comes Paint, which records vector-like draw commands (the display list),
and Rasterization, which turns those commands into bitmaps.
4. Paint & Rasterization
At this point, the browser knows what every element looks like (computed styles) and where everything goes (layout tree).
The next step is to transform them into bitmaps tiles.
Meanwhile, Skia / WebRender / CoreGraphics: happy little tiles everywhere
What happens here
The browser walks the layout tree and generates a display list, a sequence of draw commands like:
These commands are ordered according to the CSS painting order, which takes stacking contexts (e.g. z-index)
and element types into account. Later commands in the list paint on top of earlier ones.
They’re still instructions, not images yet.Rasterization turns them into bitmap tiles stored in memory, ready for compositing.
Rasterization is just one way to turn geometry into images.
Game engines often use ray tracing or path tracing for more realistic lighting, but browsers stick
to rasterization because it’s fast and parallelizable.
You can experiment with ray/path tracing in browsers through WebGL or WebGPU, typically inside a <canvas>
element, but that’s outside the built-in rendering pipeline.
Where it runs (CPU vs GPU)
The CPU typically constructs the display list.
Rasterization can run on either CPU or GPU depending on engine, driver, and platform.
Engine differences
Chrome’s Blink, for example, uses Skia as the graphics library to rasterize tiles, GPU-accelerated by default.
Safari’s WebKit relies on Core Graphics / Core Animation.
Firefox’s Gecko uses WebRender, which sends the display list directly to the GPU, making rasterization and compositing fully GPU-driven.
Tiling
Instead of painting the whole page at once, the browser splits it into tiles: small rectangular chunks,
often around a few hundred pixels across, though exact sizes vary by engine and situation.
Each tile is rasterized independently, often in parallel across threads or GPU cores.
Why tiles?
If only a small part of the screen changes, only those tiles need to be re-rasterized instead of redrawing the entire page.
Tile boundaries are an internal detail and aren’t consistently exposed in DevTools.
Paint flashing shows repainted regions, not tile borders.
The Layers/Rendering overlays show compositor layer edges, which may look like large horizontal
or vertical strips if a layer spans the viewport.
In other words, DevTools can help you spot repaints and compositor layers, but it won’t reveal the neat grid of tiles used internally.
If you don’t see the Rendering panel in DevTools:
Cmd+Shift+P / Ctrl+Shift+P → type “Show Rendering” → select it to enable.
Why Paint can be expensive
Paint cost scales with how many pixels you touch and how complex each pixel is to compute.
Cheap:background-color, border, simple fills.
Moderate:color, font, basic images.
Expensive: large box-shadows, gradients, complex SVGs, heavy text effects.
Filters: per-pixel ones like brightness(), contrast(), or invert() are light,
but effects like blur() or drop-shadow() sample neighbors and quickly add up.
Backdrop filters: heaviest of all, since the browser must first capture the pixels behind
the element into a texture, then apply the filter to that snapshot.
Even cheap operations add up when they cover a large area.
For example, animating background-color on <body> invalidates most or all tiles,
forcing massive repaints every frame.
Frame deadlines
All these stages (Style → Layout → Paint) run on the main thread.
If JavaScript blocks the main thread for more than the frame budget (~16 ms at 60 Hz),
the renderer misses the deadline and simply shows the previous frame again,
which appears as stutter rather than smooth motion.
Ways to mitigate:
Compute heavy JS into smaller chunks via requestAnimationFrame() so rendering can slot in between.
Offload expensive work to Web Workers when possible.
Output of this stage
A set of rasterized tiles/bitmap chunks of the page.
If rasterization happens on the GPU, these tiles are already in GPU memory as textures.
If it happens on the CPU, the bitmaps must be uploaded to the GPU as textures afterward.
Either way, in the next step the compositor will sample and blend these textures into the final frame.
5. Compositing
By now, the browser knows what each element looks like, where it should be placed, and in what order it should be drawn.
That’s enough to render a page… but how we render it makes all the difference for performance.
Why compositing exists
The naïve approach would be to render the entire page into a single big image, and just move that when you scroll.
Works great when things are static, terrible if you have animations. One small change means re-rasterizing everything.
A step better is to render only the viewport, redraw as you scroll.
Saves some work, but still costly for animations, since you may repaint large areas each frame.
Modern browsers use compositing instead, they split the page into multiple layers,
rasterize those layers separately, and then combine them in the compositor.
This way, animations often only require moving an existing layer’s texture, not repainting the whole page.
Layer promotion
Most elements just get painted into their parent’s layer.
But some are “promoted” to their own compositing layer, which can then move or animate independently.
Think of Photoshop: instead of flattening everything onto one canvas, some layers stay separate.
Strong vs. soft candidates
Strong candidates → almost guaranteed promotion:
transform (especially 3D transforms like translateZ(0))
opacity
Explicit hints like will-change (most engines will treat certain properties like transform or opacity
as strong signals, but not all properties are supported, e.g. will-change: mask-image; does nothing in Safari)
These usually bypass heuristics and go straight to their own GPU-backed layer,
since the compositor can animate them with just matrix multiplications.
Soft candidates, → heuristic-driven:
filter, mask, clip-path
position: fixed; or sticky
<video>, <canvas>
Here the engine weighs cost vs. benefit: promotion uses VRAM and upload bandwidth;
if repainting is cheaper, it won’t promote.
In my case, Safari didn’t promote the moving circular mask by default.
Its heuristics didn’t treat mask/mask-image as worth a separate layer so every frame forced a repaint.
Adding transform: translateZ(0); fixed it, because a 3D transform is a strong promotion trigger.
Once promoted, Safari could simply move the layer’s texture instead of repainting the mask → smooth animation.
Field notes from my Safari bug:
I tried a few different hints to convince Safari to promote the masked element:
will-change: mask; / mask-image → no effect
transform: translate(0); / translateX(0) → no effect (often optimized away if there’s no visible change)
transform: translateZ(0); → worked!
So while transform and opacity are generally strong candidates for promotion,
properties like mask aren’t consistently recognized across engines. That’s why sometimes you need
a “force-promotion” trick like a 3D transform.
Trade-offs, layers and tiling
Layers are essentially offscreen bitmaps. Each additional layer brings some trade-offs:
More VRAM usage to store textures.
CPU → GPU upload cost if the layer was rasterized on the CPU, GPUs are fast once data is there, but getting it across the bus is expensive.
More overdraw when layers overlap.
Possible blurrier text because promoted layers can disable subpixel antialiasing.
Tiling overhead where big layers get split into smaller tiles for efficiency,
but the more layers you have, the more tiles the system must manage.
Overdraw means the same pixel gets painted multiple times in a frame, but only the topmost value survives,
the rest of the work is wasted.
Unlike 3D graphics, this pipeline doesn’t use depth buffers to skip hidden pixels.
Some engines add lighter tricks (e.g. Skia can skip fully covered layers), but overlapping content
still increases GPU load.
That’s why browsers rely on heuristics: too few layers and you repaint huge areas unnecessarily;
too many and you waste GPU resources.
So compositing is powerful, but it’s a surgical tool, not something to sprinkle everywhere.
Main thread vs Compositor thread
Main thread: Parsing → Style → Layout → Paint.
Compositor thread: runs separately, takes rasterized layers, and assembles frames.
If only compositor-friendly properties change (transform, opacity),
it can animate them independently at the display’s refresh rate, without waiting on the main thread.
If a change affects Layout or Paint (width, top, color), the compositor has to wait for
the main thread to finish those stages first, which slows things down.
GPU transforms
Once an element is on its own layer, transform and opacity changes are applied on the GPU.
Under the hood, shaders apply matrix multiplications to the layer’s texture in screen space, no need to re-rasterize the content.
Cheap, smooth, hardware-accelerated.
This is why transform: translateX(...) is animation-friendly, while left: ...
forces: Layout → Paint → Composite.
Output of this stage
A single composited frame: the compositor thread takes the rasterized tiles and layers,
orders them according to the stacking contexts, and blends them together into a final image.
That finished frame is then handed to the display system, which will show it on the next VSync.
6. Display (Buffers & Vsync)
This is the last link in the chain.
The compositor has blended all layers into a final framebuffer in GPU memory,
but before those pixels reach the monitor, the browser and GPU need a strategy to avoid visual
artifacts like tearing and to keep motion smooth.
That’s where buffering and VSync (Vertical Synchronization) come in.
Double buffering
The GPU maintains two buffers:
Front buffer: currently being scanned out to the display.
Back buffer: where the next frame is rendered.
Once the back buffer is ready, the buffers are swapped: the back becomes the new front,
and the old front is reused as the new back.
This swap happens in sync with the monitor’s refresh rate (VSync),
so the screen never shows parts of two different frames at once, avoiding tearing.
The “vertical” in VSync comes from old CRT displays, which refreshed top-to-bottom.
Buffer swaps were synced with the vertical retrace (when the beam returned to the top) to avoid tearing.
Triple buffering
Some systems use three buffers: one front + two backs.
This allows the GPU to start rendering a new frame even if one back buffer is still waiting for VSync.
Benefit: smoother scheduling, less stutter.
Trade-off: more VRAM, and added latency: a finished frame may wait an extra refresh before showing up.
Many platforms dynamically switch between double and triple buffering depending on GPU load and timing conditions.
If the browser delivers a frame before the deadline, it’s shown smoothly.
If it misses, that frame is delayed until the next refresh or dropped, causing a visible stutter.
With VSync off: frames can be shown immediately, but you risk tearing (two frames spliced in one refresh).
Modern monitors support Variable Refresh Rate (VRR), known as NVIDIA G-Sync or AMD FreeSync.
Instead of the GPU waiting for the next fixed tick, the monitor adapts its refresh cycle to match when a frame is ready.
This nearly eliminates tearing and stutter, and reduces latency, but only works if both GPU and display support it.
Browsers typically stick to fixed VSync for predictability, but VRR can help in full-screen or WebGPU contexts.
The three axes of smoothness
When people say “it feels smooth,” they’re usually describing three things at once:
FPS: did we make enough frames per second?
Frame pacing: were those frames delivered evenly on time?
Latency: how long did it take from input (a click, a keypress) to the screen reacting?
All three matter.
High FPS without pacing feels jittery, while pacing without responsiveness feels sluggish.
This is why we talk about the frame budget: at 60 Hz, the GPU has ~16 ms to deliver a frame; at 120 Hz, just ~8 ms.
Consistent pacing and low latency matter just as much as raw FPS.
Buffering strategies and missed deadlines affect all three axes: too few buffers risks tearing, too many risks added latency.
End of the journey
From raw HTML + CSS text, we went through:
Parsing → DOM + CSSOM
Style → computed styles
Layout → geometry (layout tree)
Paint → display list → rasterized tiles
Compositing → layers assembled by compositor thread
Display → buffers swapped on VSync
That’s how your code turns into pixels on the screen :)
Practical Takeaways
All this talk about DOMs, CSSOMs, tiles, and compositor threads is useful only if it helps you write smoother, more predictable frontends.
Here are some concrete lessons I pulled out of this deep dive (and that my Safari bug made painfully clear):
Animate the right properties
Compositor-friendly: transform, opacity
Layout/Paint-triggering: top, left, width, height, box-shadow, filter, etc.
Use GPU promotion sparingly
will-change or translateZ(0) can smooth animations by creating new layers.
But more layers = more VRAM + more blending cost + sometimes blurrier text.
Scope CSS variables wisely
Updating :root variables can trigger recalcs across the whole page.
Define them closer to where they’re used if you’re changing them often.
Avoid layout thrashing
Don’t mix reads (offsetWidth, getBoundingClientRect()) with writes (el.style.height = ...) in the same frame.
DevTools shows you where time goes: Style, Layout, Paint, Composite.
Use Chrome’s Performance panel or Safari’s Timeline to confirm before optimizing.
Respect the frame budget
16 ms @60 Hz, 8 ms @120 Hz.
Every stage you can skip (e.g. no layout/paint, compositor-only animation) buys you headroom.
Keep perspective
You don’t need to memorize Skia, Core Animation, or WebRender internals.
A mental model of the pipeline is enough to reason about stutter.
Don’t code in fear: premature optimization is a trap. Build first → measure → then fix.
With experience, many “good defaults” come naturally.
Wrapping Up
What started as a simple Safari annoyance, ended up teaching me far more than just a fix.
Once you see how browsers turn code into pixels, jank stops feeling like random bad luck
and starts looking like a system you can reason about.
You don’t need to optimize everything up front. Build first, measure where it hurts, then fix with intent.
With even a rough mental model of the rendering pipeline, performance issues stop being mysterious
and start being solvable.
For me, that was the real win: a reminder of why I love frontend work.
There’s always another layer to peel back, and the deeper I go, the better I get at shaping smooth, reliable experiences.